
Solar Performance Data
The Dashboard
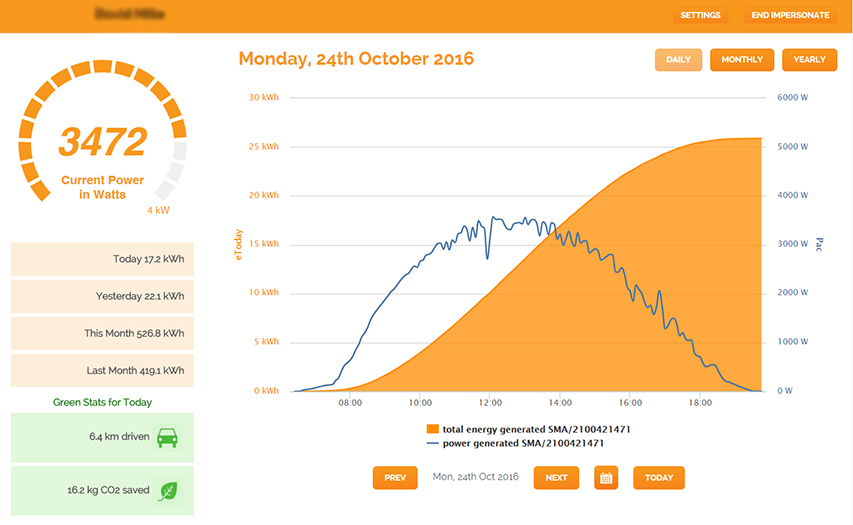
When you log in to your online account, the Dashboard is the first page you will be taken to. You will be able to see at a glance how your solar is performing that day.
The graph above is typical of what you might seen on a sunny day. The blue line shows the power generated from the customer’s inverter, starting and returning to zero at the beginning and end of the day.
From this page, you can navigate to check out how your solar performed on any given day in the past, and click to review monthly and yearly output data.
Inverter Status
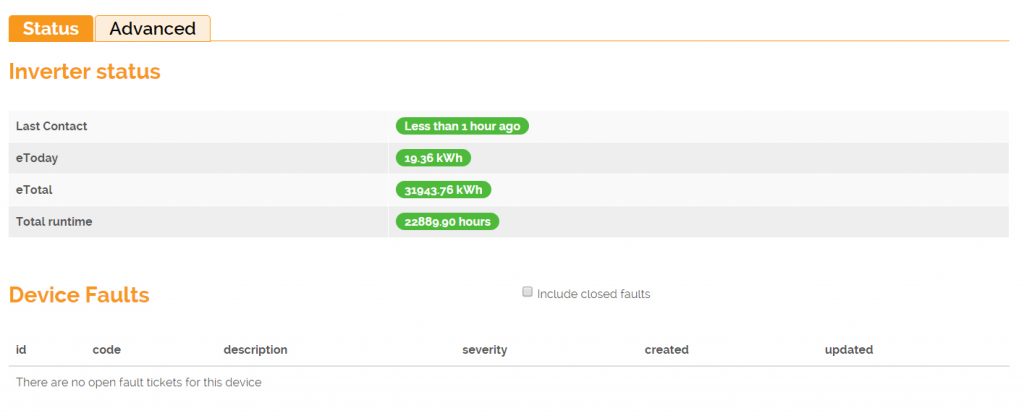
If you receive an email alert notifying you of a system failure or you suspect that that your solar system is under-performing, the Inverter Status page will provide more detailed information.
We are also able to access this page remotely so if you need to contact us, we’ll be able to advise on the best course of action.